Causal Loop Diagrams model system dynamics
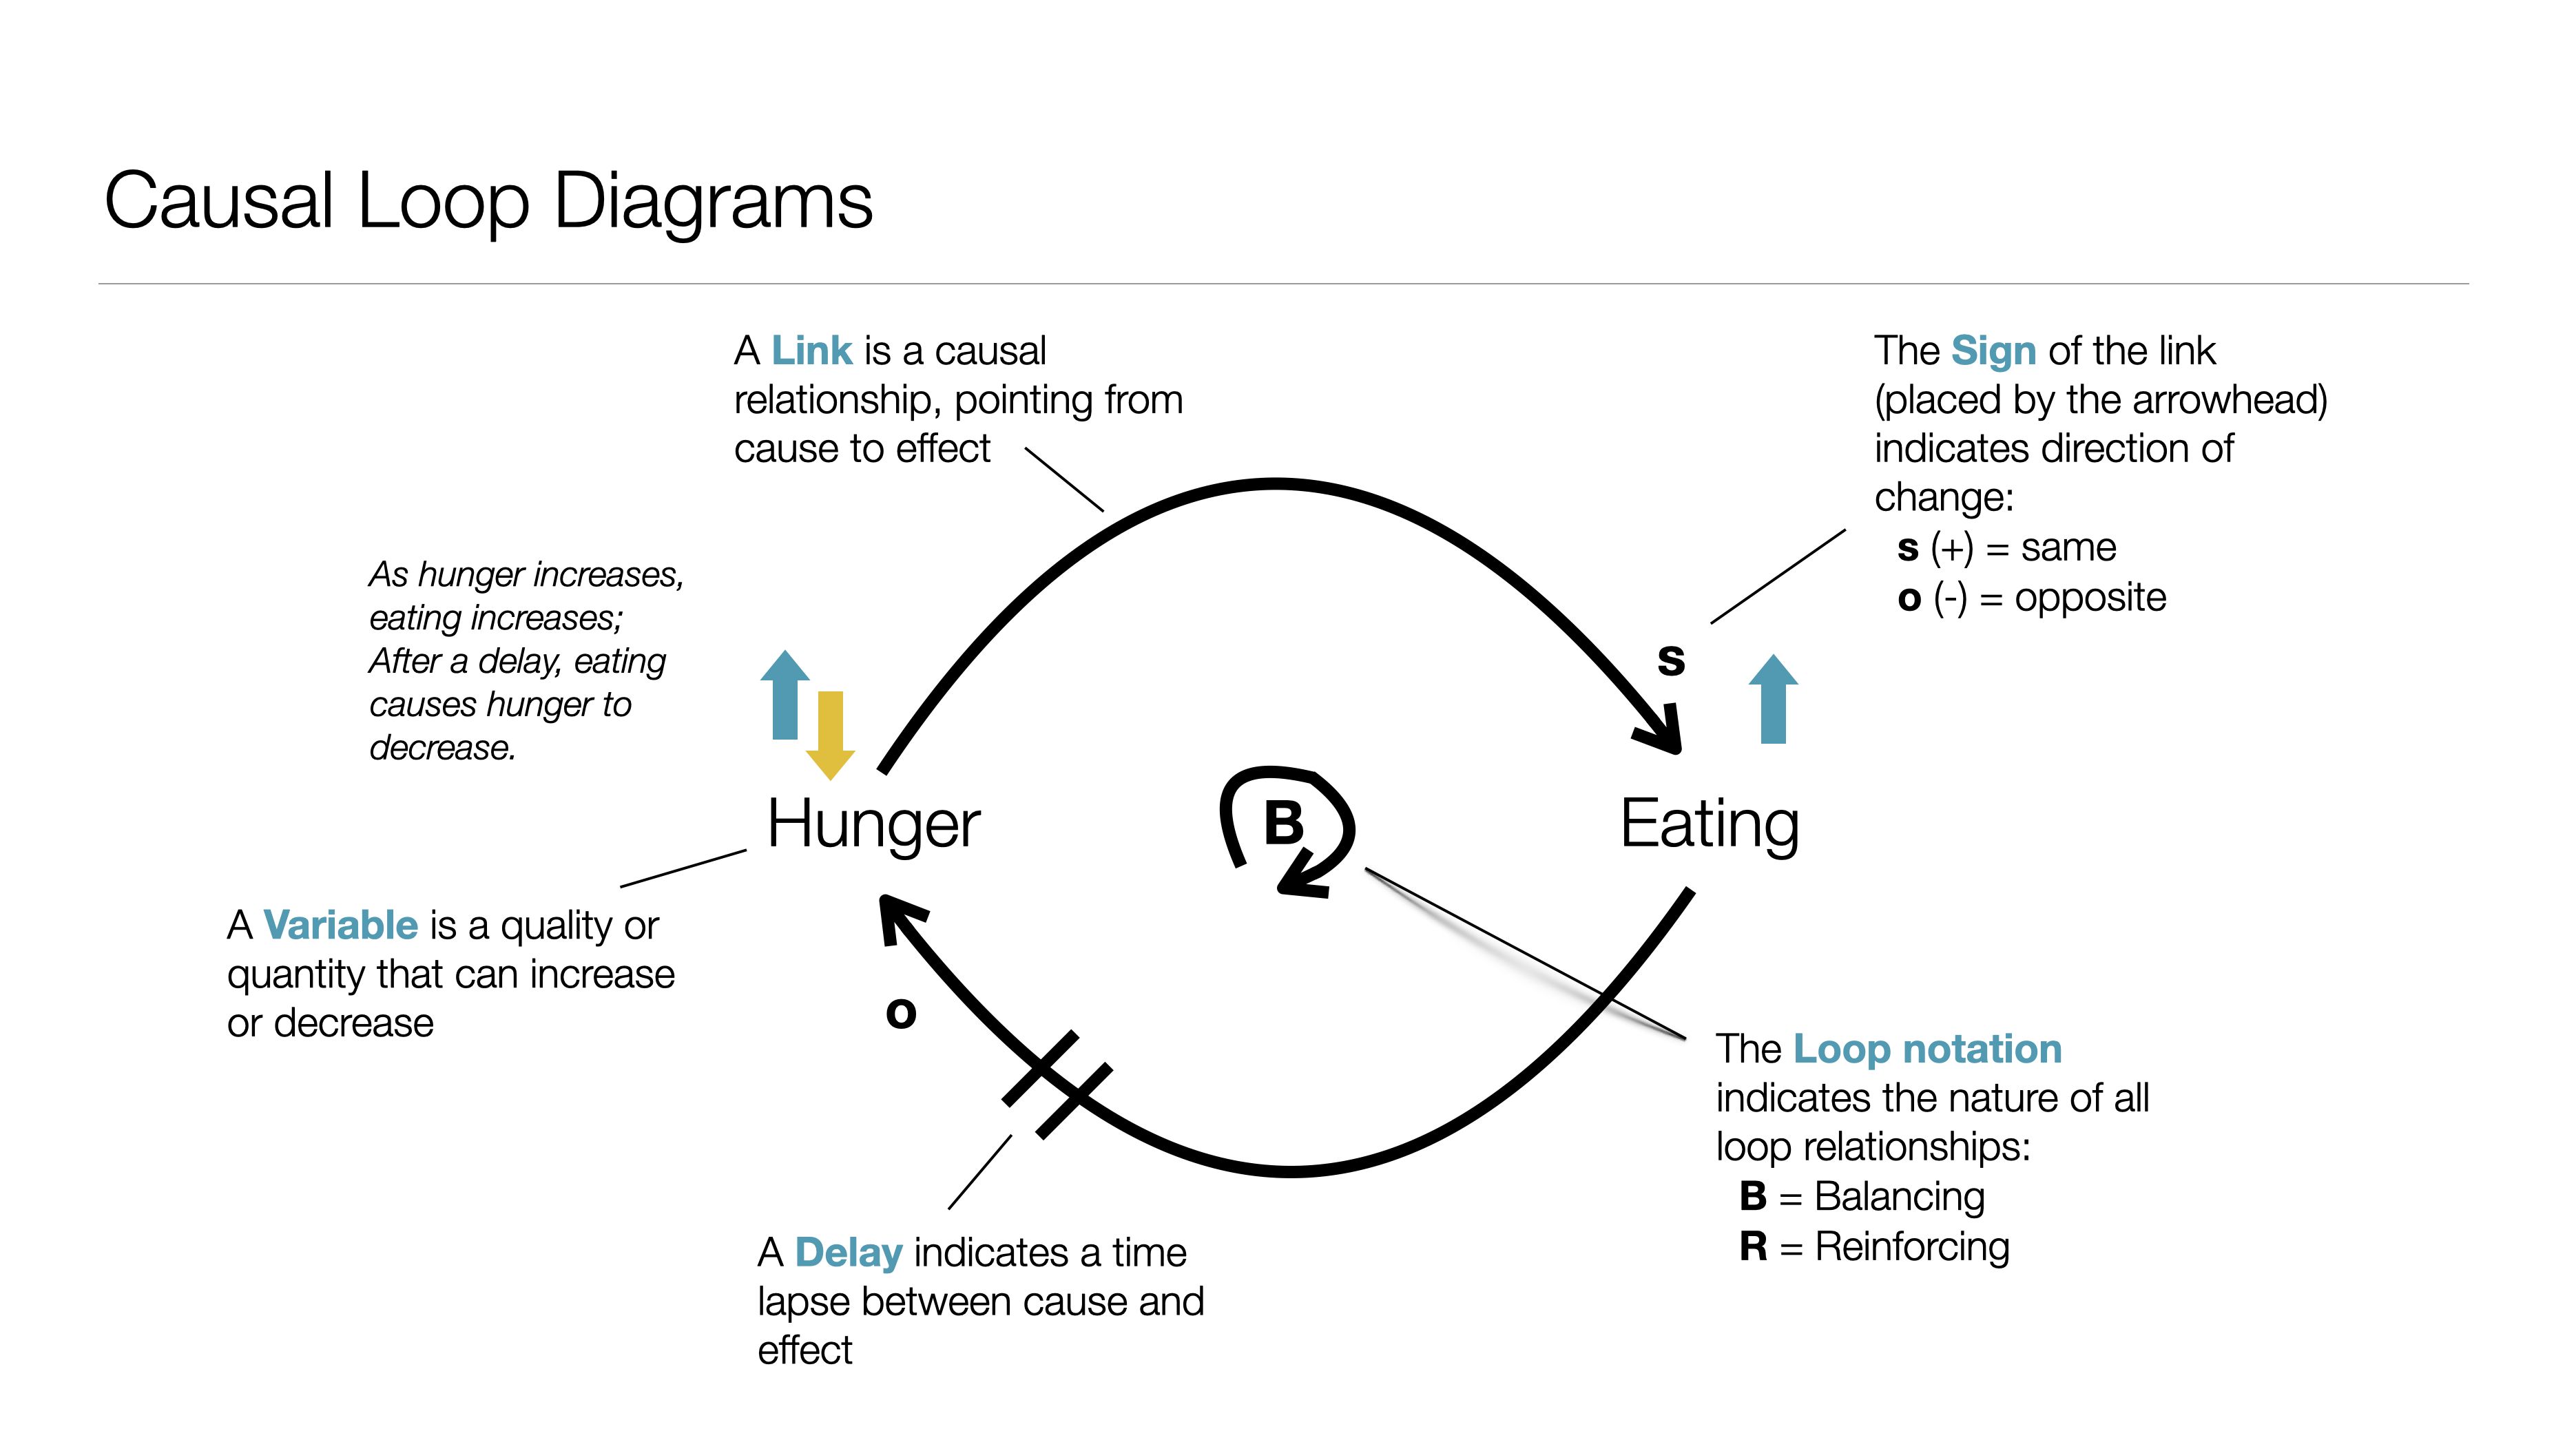
A "Causal Loop Diagram" (CLD) is a tool used in Systems Thinking to visually represent and analyze the interactions and feedback loops among different variables within a system. It helps in understanding the complex web of cause and effect relationships that influence behavior in a system over time.
#systems-thinking #visual-thinking
See also: